本文主要介绍missing-container-metrics监控pod OOMKilled
背景
Kubernetes 默认情况下使用 cAdvisor 以及 kube-state-metrics 来收集容器的各项指标,绝大多数场景下能够满足业务的基本的需求,但还是有所欠缺,比如缺少对以下几个指标的收集
- OOM kill
- 容器重启的次数
- 容器的退出码
missing-container-metrics 这个metrics 弥补了 cAdvisor 的缺陷,新增了以上几个指标,用户可以利用这些指标迅速定位某些故障。例如,假设某个容器有多个子进程,其中某个子进程被 OOM kill,但容器还在运行,如果不对 OOM kill 进行监控,用户很难对故障进行定位
安装部署
1,添加helm仓库
helm repo add missing-container-metrics https://draganm.github.io/missing-container-metrics
2, 下载helm到本地,可以修改对应的 value.yaml
helm pull missing-container-metrics/missing-container-metrics
tar xvf missing-container-metrics-0.1.1.tgz
cd  missing-container-metrics
ls
Chart.yaml  README.md  templates  values.yaml
3, 可配置项
| 变量 | 描述说明 | 默认值 |
|---|---|---|
| image.repository | 镜像名称 | dmilhdef/missing-container-metrics |
| image.pullPolicy | 镜像拉取策略 | IfNotPresent |
| image.tag | 镜像tag | v0.21.0 |
| imagePullSecrets | 拉取镜像的secret | [] |
| nameOverride | 覆盖生成的图表名称。默认为 .Chart.Name。 | |
| fullnameOverride | 覆盖生成的版本名称。默认为 .Release.Name。 | |
| podAnnotations | Pod 的Annotations | {"prometheus.io/scrape": "true", "prometheus.io/port": "3001"} |
| podSecurityContext | 为 pod 设置安全上下文 | |
| securityContext | 为 pod 中的容器设置安全上下文 | |
| resources | PU/内存资源请求/限制 | {} |
| useDocker | 从 Docker 获取容器信息,如果容器运行时为docker ,设置为true | false |
| useContainerd | 从 Containerd 获取容器信息,如果容器运行时为containers ,设置为true | true |
由于我们集群的运行时是docker的 所以需要修改missing-container-metrics/values.yaml 中`useDocker为true,然后安装
4,执行安装
# kubectl create namespace missing-container-metrics
# helm install missing-container-metrics  missing-container-metrics -n missing-container-metrics
NAME: missing-container-metrics
LAST DEPLOYED: Sun Jun 26 13:32:43 2022
NAMESPACE: missing-container-metrics
STATUS: deployed
REVISION: 1
TEST SUITE: None


#helm  -n missing-container-metrics list
NAME     NAMESPACE       REVISION        UPDATED     STATUS          CHART                           APP VERSION
missing-container-metrics       missing-container-metrics     1               2022-09-17 22:43:56.998806908 +0800 CST deployed        missing-container-metrics-0.1.1 0.21.0


[root@VM-249-130-tlinux ~]# kubectl  -n missing-container-metrics  get  pods | grep missing-container-metrics
missing-container-metrics-bf7gq       1/1     Running   0          60s
可以通过访问服务的3001端口查看metrics,例如
#curl 172.16.0.29:3001/metrics | grep memory-request-limit
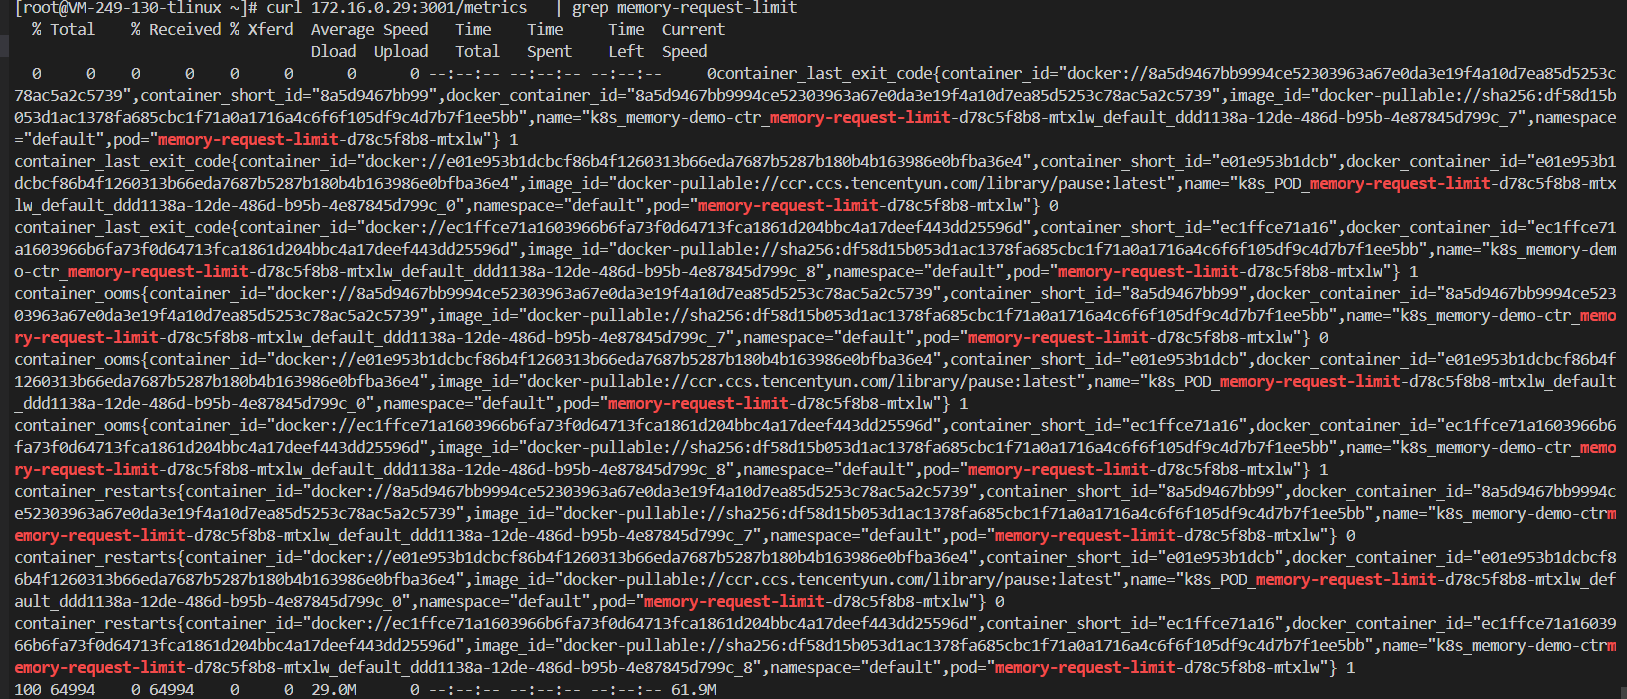
服务公开了如下的指标:
| 指标 | 说明 |
|---|---|
| container_restarts | 容器的重启次数 |
| container_ooms | 容器的 OOM 杀死数。这涵盖了容器 cgroup 中任何进程的 OOM 终止 |
| container_last_exit_code | 容器的最后退出代码 |
每一个指标包含如下标签:
| 指标ID | 说明 |
|---|---|
| docker_container_id | 容器的完整 ID |
| container_short_id | Docker 容器 ID 的前 6 个字节 |
| docker_container_id | 容器 id 以与 kubernetes pod 指标相同的格式表示 - 以容器运行时为前缀docker://并 containerd://取决于容器运行时。这使得 Prometheus 中的kube_pod_container_info`` |
| name | 容器的名称 |
| image_id | 镜像id 以与 k8s pod 的指标相同的格式表示。这使得 Prometheus 中的kube_pod_container_info |
| pod | 如果io.kubernetes.pod.name在容器上设置了pod标签,则其值将设置为指标中的标签 |
| namespace | 如果io.kubernetes.pod.namespace容器上设置了namespace`标签,则其值将设置为指标的标签 |
与自建prometheus集成
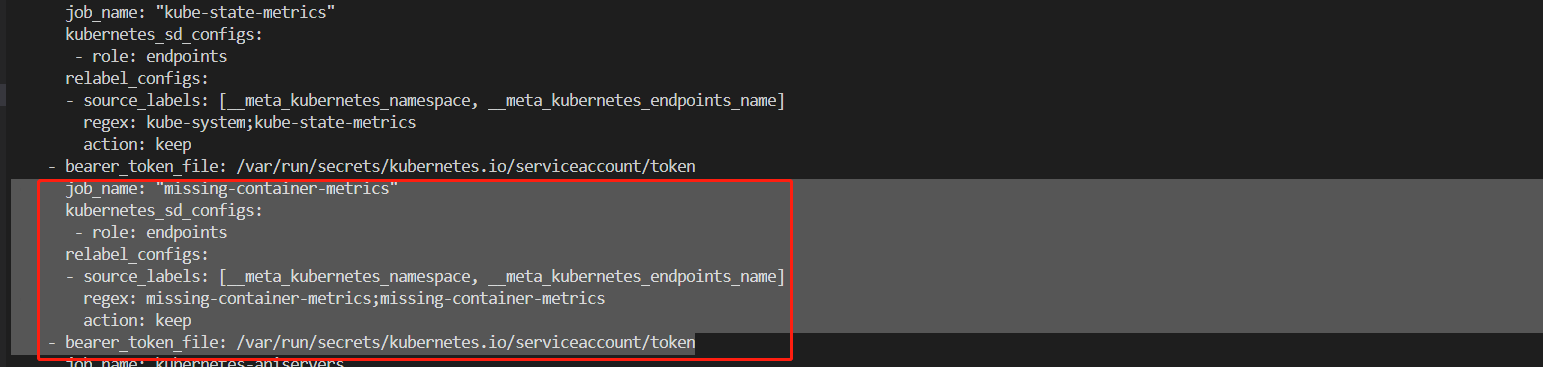
1,修改prometheus配置文件
kube-state-metrics是部署在kube-system命名空间下的,因此在正则匹配上,命名空间为kube-system,svc名称为missing-container-metrics,否则就不进行监控
      job_name: "missing-container-metrics"
      kubernetes_sd_configs:
       - role: endpoints
      relabel_configs:
      - source_labels: [__meta_kubernetes_namespace, __meta_kubernetes_endpoints_name]
        regex: missing-container-metrics;missing-container-metrics
        action: keep
    - bearer_token_file: /var/run/secrets/kubernetes.io/serviceaccount/token
由于helm部署只部署了DaemonSet ,可以手动创建一个svc
apiVersion: v1
kind: Service
metadata:
  name: missing-container-metrics
  namespace: missing-container-metrics
spec:
  ports:
  - name: 3001-3001-tcp-2tsffjchpoi
    port: 3001
    protocol: TCP
    targetPort: 3001
  selector:
    app.kubernetes.io/instance: missing-container-metrics
    app.kubernetes.io/name: missing-container-metrics
  sessionAffinity: None
  type: ClusterIP
查看prometheus的targets
部署成功后,prometheus的target会出现如下标志

创建告警规则
###添加
prometheusOperator:
podMonitor:
# Create a Prometheus Operator PodMonitor resource
enabled: true
# Namespace defaults to the Release namespace but can be overridden
namespace: ""
# Additional labels to add to the PodMonitor so it matches the Operator's podMonitorSelector
selector:
app.kubernetes.io/name: missing-container-metrics
prometheusRule:
# Create a Prometheus Operator PrometheusRule resource
enabled: true
# Namespace defaults to the Release namespace but can be overridden
namespace: ""
# Additional labels to add to the PrometheusRule so it matches the Operator's ruleSelector
selector:
prometheus: k8s
role: alert-rules
# The rules can be set here. An example is defined here but can be overridden.
rules:
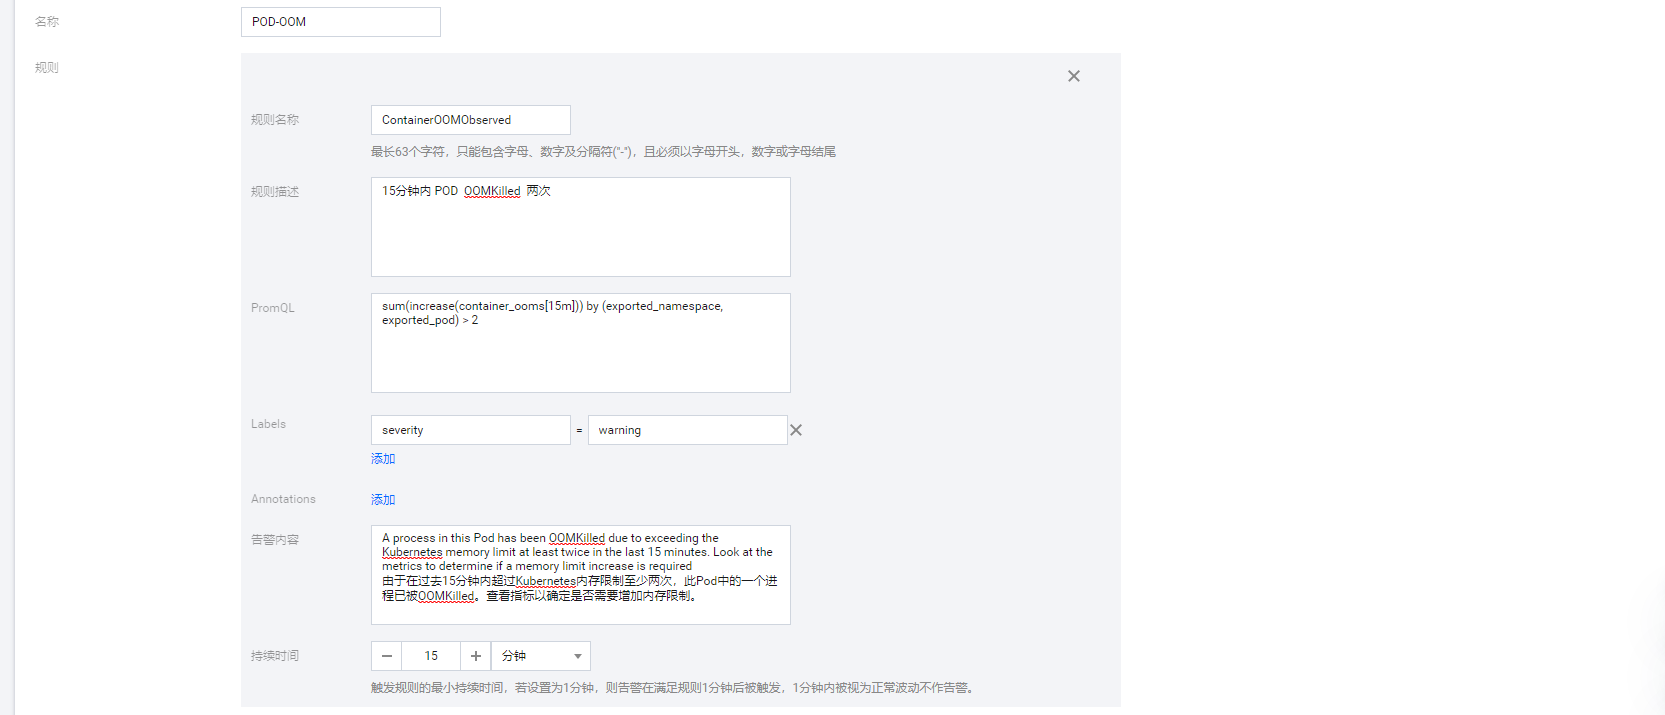
- alert: ContainerOOMObserved
annotations:
message: A process in this Pod has been OOMKilled due to exceeding the Kubernetes memory limit at least twice in the last 15 minutes. Look at the metrics to determine if a memory limit increase is required.
expr: sum(increase(container_ooms[15m])) by (exported_namespace, exported_pod) > 2
labels:
severity: warning
- alert: ContainerOOMObserved
annotations:
message: A process in this Pod has been OOMKilled due to exceeding the Kubernetes memory limit at least ten times in the last 15 minutes. Look at the metrics to determine if a memory limit increase is required.
expr: sum(increase(container_ooms[15m])) by (exported_namespace, exported_pod) > 10
labels:
severity: critical
2,模拟OOM
创建一个 Pod,尝试分配超出其限制的内存。 这是一个 Pod 的配置文件,其拥有一个容器,该容器的内存请求为 50 MiB,内存限制为 100 MiB:
在配置文件的 args 部分中,你可以看到容器会尝试分配 250 MiB 内存,这远高于 100 MiB 的限制。
apiVersion: apps/v1
kind: Deployment
metadata:
  labels:
    k8s-app: memory-request-limit
    qcloud-app: memory-request-limit
  name: memory-request-limit
  namespace: default
spec:
  replicas: 1
  selector:
    matchLabels:
      k8s-app: memory-request-limit
      qcloud-app: memory-request-limit
  template:
    metadata:
      labels:
        k8s-app: memory-request-limit
        qcloud-app: memory-request-limit
    spec:
      containers:
      - args:
        - --vm
        - "1"
        - --vm-bytes
        - 250M
        - --vm-hang
        - "1"
        command:
        - stress
        image: polinux/stress:latest
        imagePullPolicy: IfNotPresent
        name: memory-demo-ctr
        resources:
          limits:
            memory: 100Mi
          requests:
            memory: 50Mi

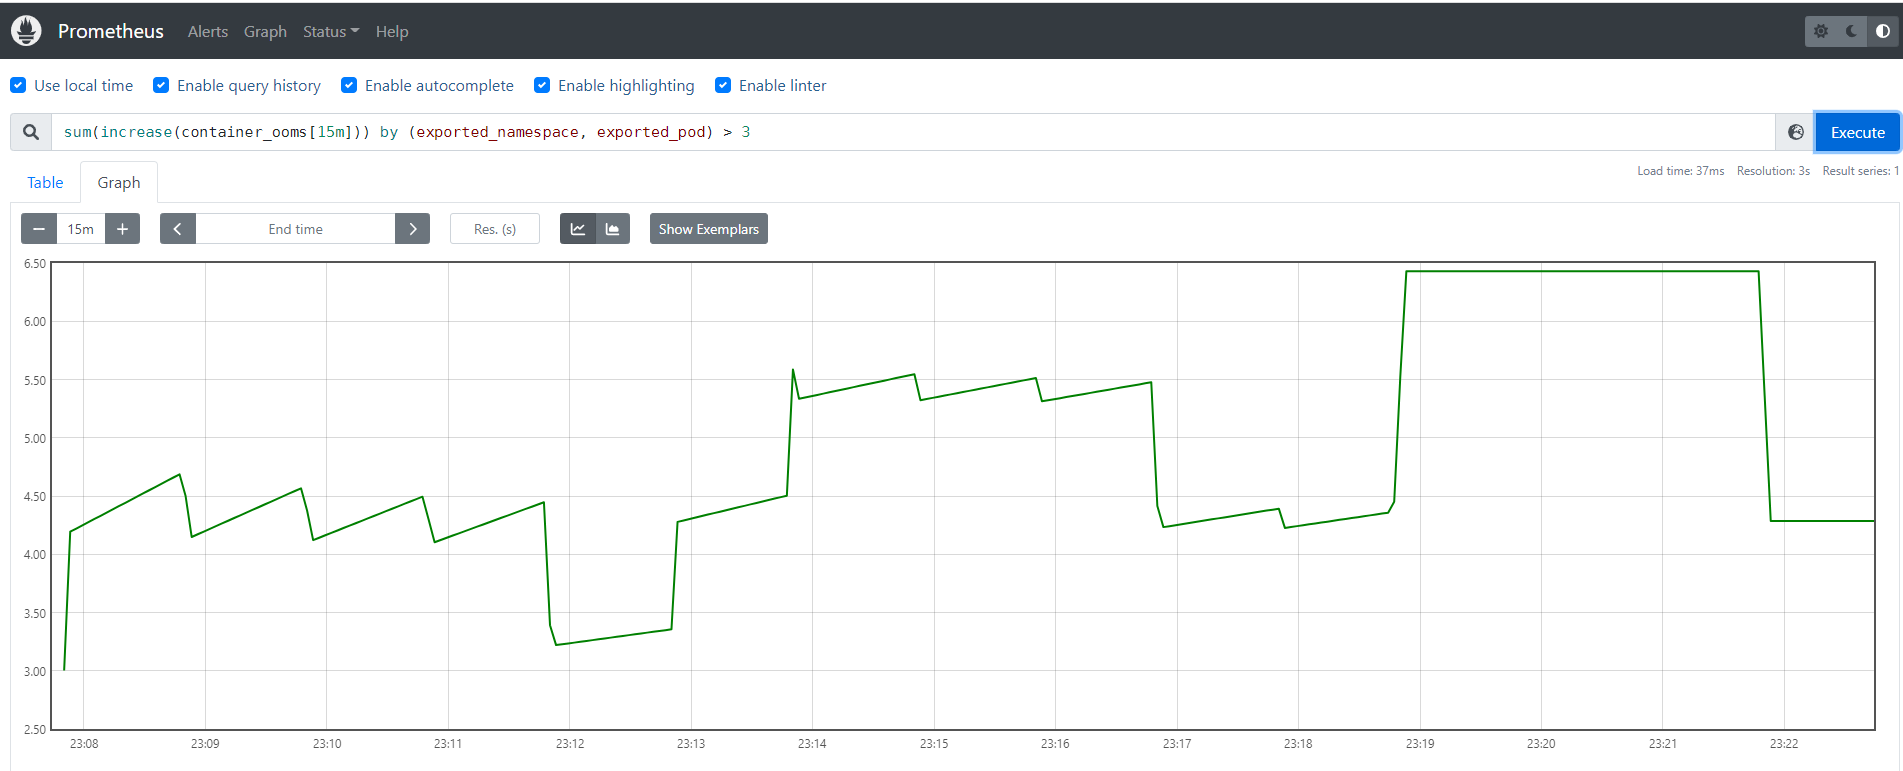
sum(increase(container_ooms[15m])) by (exported_namespace, exported_pod) > 3
云原生监控TMP使用missing-container-metrics
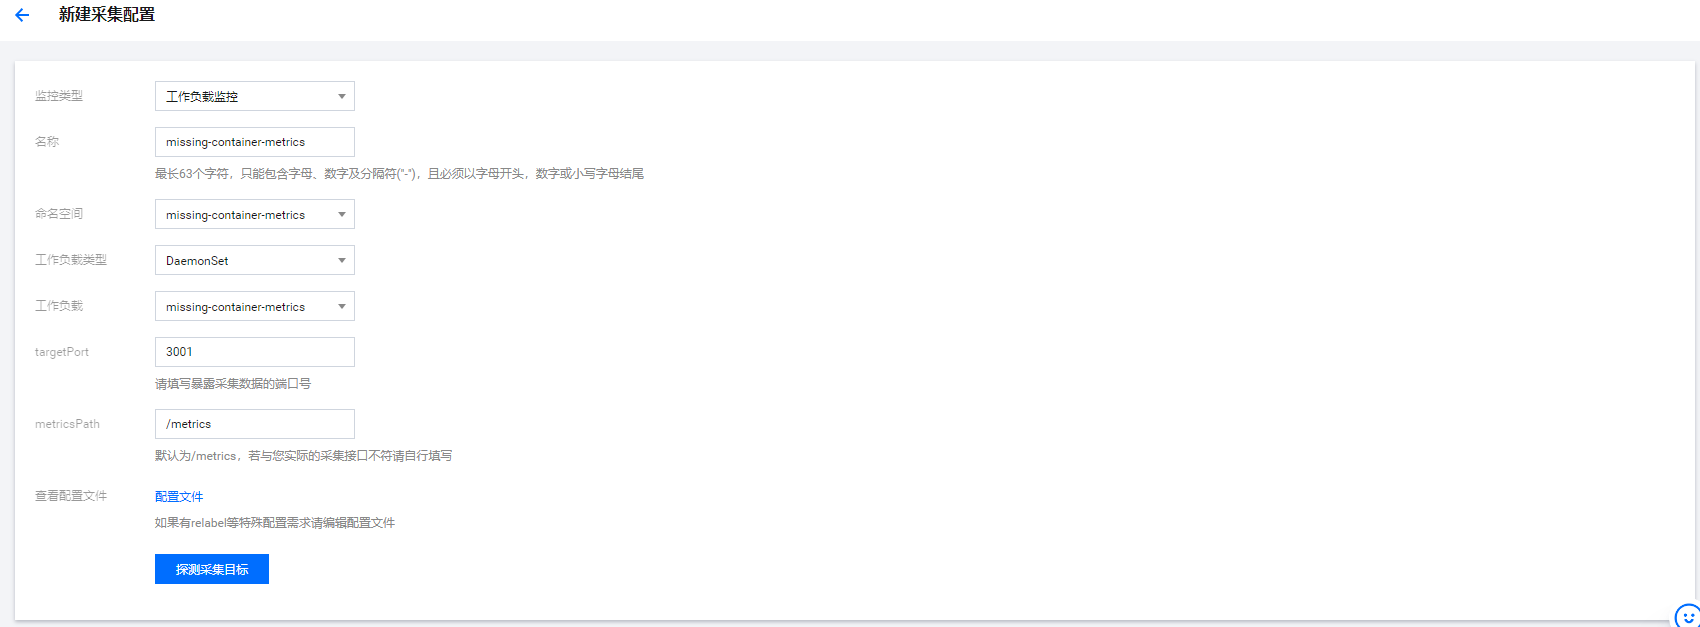
1,添加数据采集配置
登陆Promtheus 监控控制台,选择集群监控> 数据采集配置>自定义监控> 新增数据采集配置
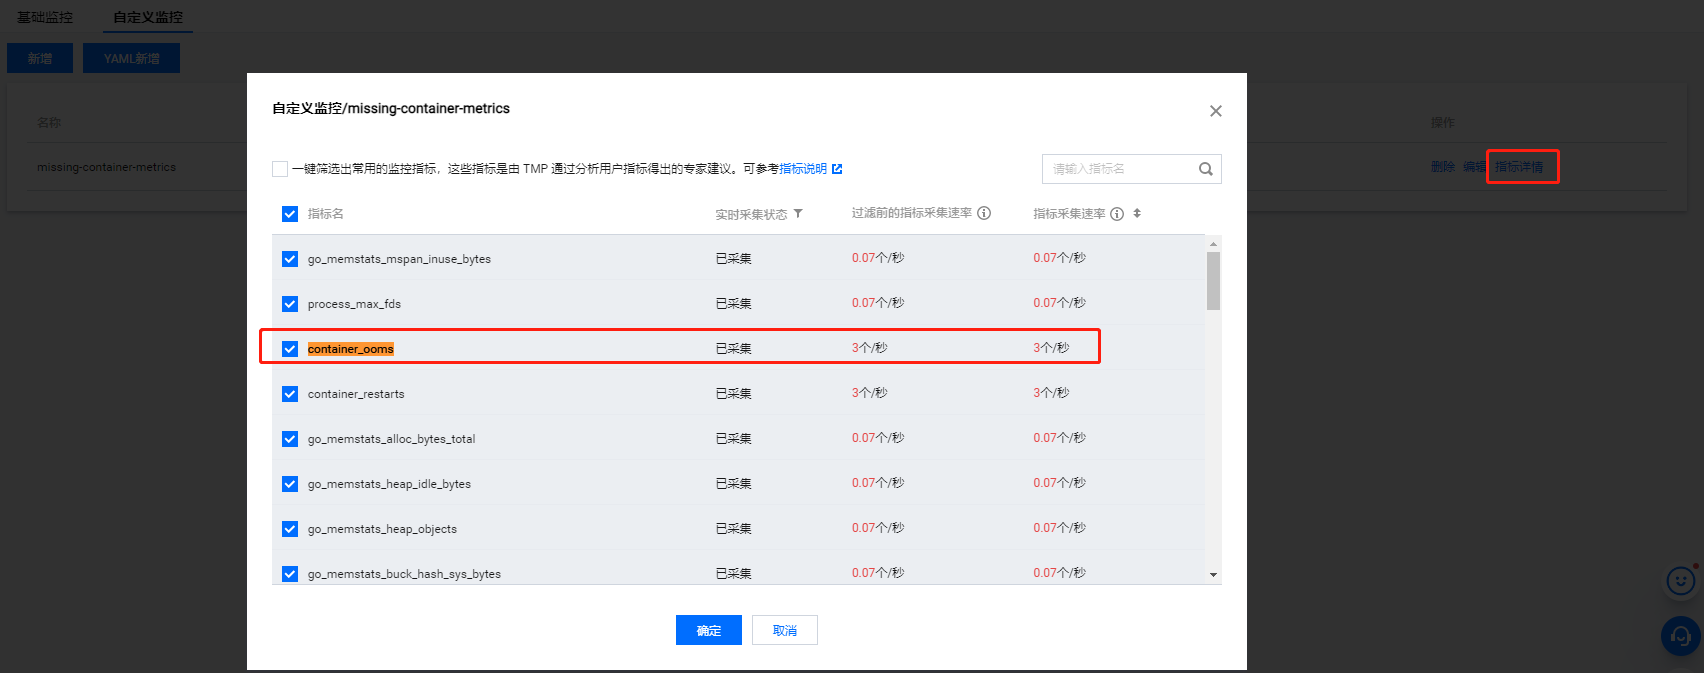
2,查看当前采集,如下图所示,表示已经采集到监控数据
3, 配置告警规则prometheusRule
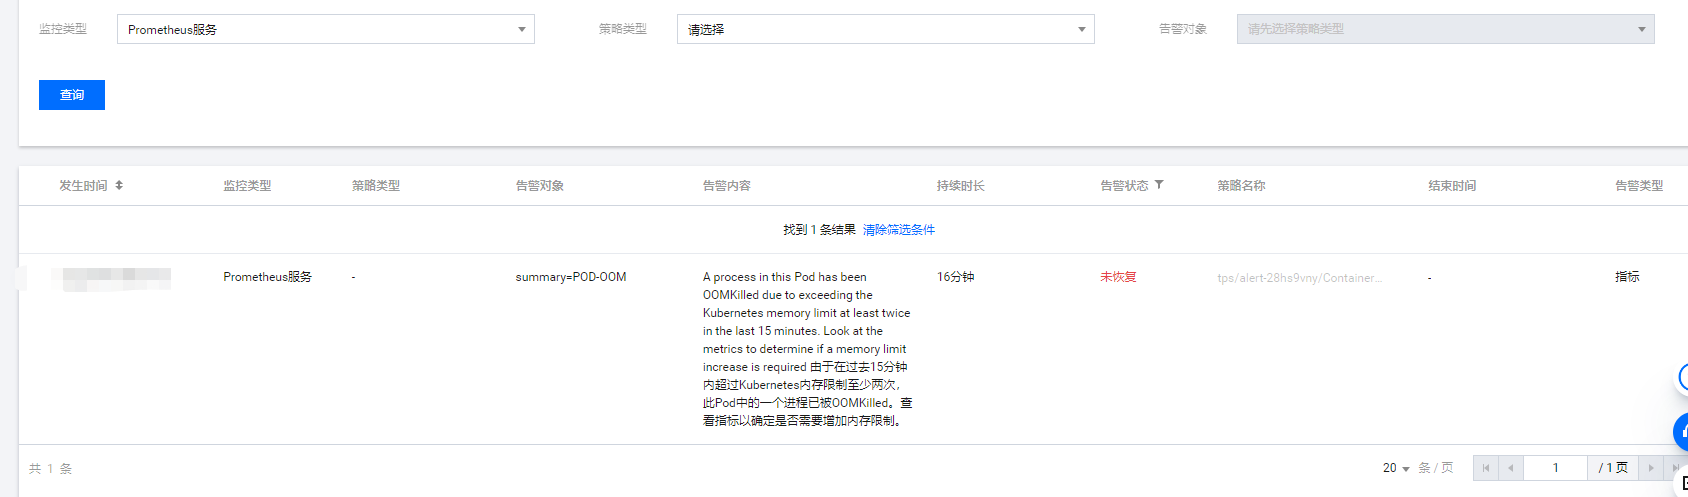
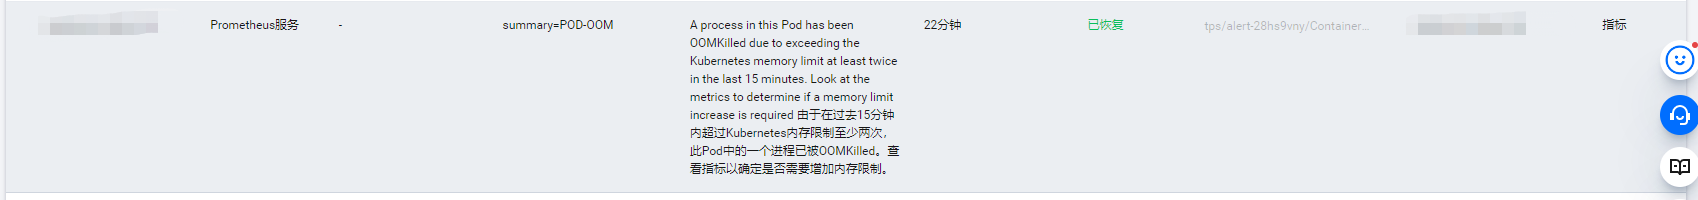
查看告警历史